Top: John S. Allen's
home page
Up: Table of Contents
Previous: Analysis by specific variables
Next: Findings and recommendations
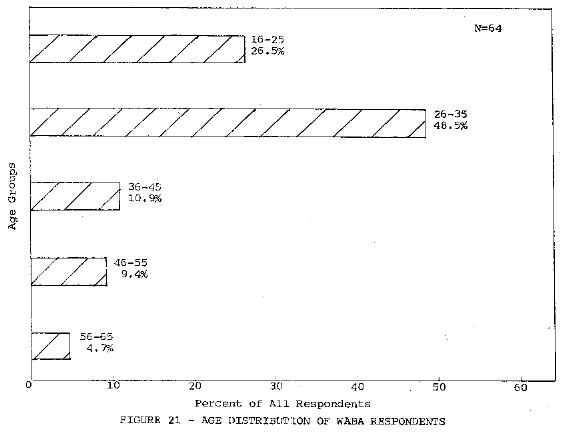
CHAPTER VICOMPARISON OF NATIONAL DATA WITH LOCAL DATAAll the information up to this point is based on returns from 3,270 respondents in the national bicycling organization, the League of American Wheelmen. In order to compare responses from regular bicycle users who belonged only to a local bicycle club, approximately 900 members of the Washington Area Bicyclist Association (WABA), located in the District of Columbia, were asked to fill out the same questionnaire. Because the respondent from WABA had to provide his own return envelope and stamp, and no election was occurring at the same time, a much lower response rate than the 46.7 percent from L.A.W. was anticipated. A total of 101 (or 11.2 percent) questionnaires were returned, but of these, only 70 (7.8 percent of the total membership) were usable because only data from WABA members who were not also L.A.W. members were desired. With this small return, the following comparisons should be considered as approximate. In some instances, many of the analyses carried out on the national results with 3,270 responses could not be duplicated with enough reliability for only 70 respondents. Thus, in many cases, only aggregate data are examined. AGE AND SEX DISTRIBUTIONOf the 70 respondents that provided usable data, 62 or 88.6 percent of the total were male, while only 8 were female. This high percentage of males matched very closely the respondents from the national organization. This disproportionate distribution was most likely caused by directing the questionnaire at the most active rider. it was also known in advance that the local club's membership was estimated to be at least two-thirds male. The average age of the WABA respondents was 32.2, considerably lower than the 37.7 average age of the L.A.W. membership that responded. The distribution of respondent's ages of the Washington bicycle club (Figure 21) shows that the majority (75 percent) are less than 36 years of age. This compares with only 49.5 percent in this age group for the national sample. The goodness of fit test (p = .05) showed the age distribution of WABA respondents to be significantly different than L.A.W. respondents. |
FIGURE 21 - AGE DISTRIBUTION OF WABA RESPONDENTS
Age Distribution of WABA Respondents
N=64
On this figure and all those following,
N is equal to the number of respondents
to that particular question.
| Age Groups | Percent of all Respondents |
|---|---|
| 16-25 | 26.5% |
| 26-35 | 48.5% |
| 36-45 | 10.9% |
| 46-55 | 9.4% |
| 56-65 | 4.7% |
AUTOMOBILE AVAILABILITYWith respect to the availability of automobiles reported by WABA members, the findings were quite different than those reported from L.A.W.. Table 16 shows the difference between the two samples. COMPARISONS BETWEEN L.A.W. AND WABA WITH RESPECT TO AUTOMOBILE AVAILABILITY
While approximately only one of every 20 L.A.W. respondents did not have a car available for their use, almost one out of every seven WABA respondents fell into this category. It would seem likely to follow that WABA members might be bicycling more and farther, due to this lower response to automobile availability. this, however, was not the case, as is explained later. Washington, D.C., is a fairly dense city with a public transportation system that adequately serves the city proper. This may partly explain the large difference in auto availability that exists between the samples. BICYCLE TYPE AND EQUIPMENTAlthough the majority (83 percent) of WABA respondents stated that they used a bicycle with 5 or more speeds for most of their riding, this percentage is almost 14 percentage points less than L.A.W. respondents, who reported almost a unanimous 96.8 percent respondents riding a 5- or 10-speed bicycle. There were no WABA respondents stating that they used a single speed bicycle. Figure 22 shows the responses to the 5 questions regarding equipment usage. Major differences existed between the national and local samples here also, expecially in the use of mirrors (only 8.6 percent for WABA, 33 percent for L.A.W.) and lights (77 percent for WABA members, 61 percent for L.A.W. respondents). Only 20 percent of the local organization's respondents stated that they possessed an odometer to measure distance. This percentage compares with 35 percent of L.A.W. members. As in the national sample, statistical testing showed no significant difference for the mileages reported between those with odometers and those without such devices. Interestingly, helmet wearing appears to have become a common occurrence among regular bicycle users; in both cases, almost 30 percent of the respondents used head protection while riding. This may be partly responsible in the lowering of the number of serious injuries. The last item in the question on equipment usage, registration, showed that 83 percent of WABA members had their bicycles registered. This high figure, compared to only 46 percent in the national survey, is most likely accounted for because the District of Columbia is now :requiring all bicycles ridden in the District to be registered. |
FIGURE 22 - RESPONSES TO EQUIPMENT USED - WABA SAMPLE
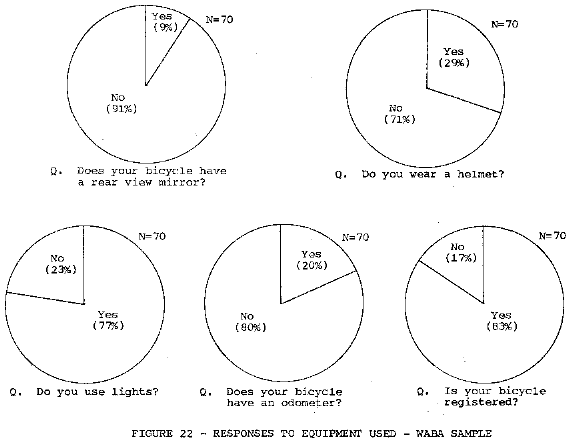
Reponses to Equipment Used - WABA Sample
| Question | No | Yes | N= |
|---|---|---|---|
| Does your bicycle have a rear view mirror | 91% | 9% | 70 |
| Do you wear a helmet | 71% | 29% | 70 |
| Do you use lights | 23% | 77% | 70 |
| Does your bicycle have an odometer | 80% | 20% | 70 |
| Is your bicycle registered | 17% | 83% | 70 |
BICYCLING EXPERIENCEOver two-thirds of the Washington area bicyclists (67.1 percent) have bicycled less than 4 years. This corresponds to 51.7 percent for the national League of American Wheelmen. A substantial number (14.3 percent) of the WABA respondents have been cycling continuously for a period longer than 10 years. This corresponds to 20.2 percent in this category for L.A.W. respondents. 1974 TOTAL MILES RIDDENThe WABA respondents reported traveling 1,536 miles a year during an average 9.3 months that they stated as being suitable for cycling. This is almost 35 percent less than the mileage reported in the national sample based on only 8.9 months riding. The mileage figure reported by WABA was compared with the mileage by city size breakdown established from the national sample. In cities over ore million, as Washington is, the miles traveled actually increased slightly above the overall average of the national survey. Part of the explanation for this difference in miles traveled may be that WABA members have been shown to be younger and less experienced than the L.A.W. respondents. Both of these variables were important when increases in miles traveled were studied. It may also be that major differences not discovered exist in riding characteristics between the two samples. The difference also carries over into the question regarding future riding. Almost 60 percent of the L.A.W. members reported that they would ride more or much more this year than last year. WABA members, on the other hand, responded that only 37 percent will be riding more or much more. Whereas L.A.W. respondents reported riding 93.3 percent of all their miles on major or minor streets and highways, only 82.4 percent of the Washington bicyclists' miles were reported ridden on these type of streets. However, major street riding for the national sample accounted for only 35 percent of all riding, while this figure climbed to 49 percent for the bicyclist in Washington. This difference may be partly responsible for the higher accident rate experienced by the Washington bicyclists, discussed shortly. TRIP PURPOSE AND LENGTHFigure 23 shows the distribution of WABA respondents riding for each trip purpose. When compared with the L.A.W. data shown is Figure 6 (page 42), it can be seen that the work and/or school trip is the most common trip made by Washington cyclists, replacing the recreation/touring trip, the most common trip made by L.A.W. members. It should also be noted that WABA respondents made 17 percent more utility trips than those in the national survey reported making. The goodness of fit test (p = .05) showed the trip purpose distribution of WABA respondents to be significantly different than the national sample. |
FIGURE 23: DISTRIBUTION OF
RESPONDENTS
WITH RESPECT TO TRIP SIZE - WABA
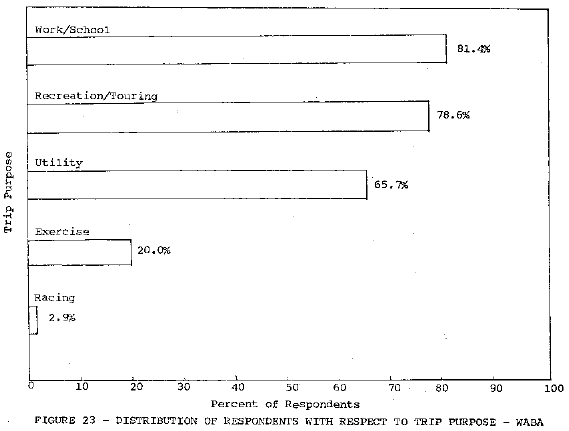
Distribution of Respondents with Respect
to Trip Purpose - WABA
| Trip Purpose | Percent of Respondents Making Trip |
|---|---|
| Work/ School |
81.4% |
| Recreation/ Touring |
78.6% |
| Utility | 65.2% |
| Exercise | 20.0% |
| Racing | 2.9% |
| Table 17 further analyzes the WABA response by stratifying the trip purpose by the
number of trips made and the average length of each trip. TRIP CHARACTERISTICS BY PURPOSE - WABA
The major difference between the two samples becomes readily apparent when Table 17 is compared with Table 8 on page 43, which presents similar information on the L.A.W. respondents. It appears that the work and school commute trip along with the utility trip is much more heavily represented both in the percentage of all trips reported and the percentage of total miles reported for the Washington cyclists. Over 80 percent of all trips taken by WABA respondents were for these purposes compared to about 50 percent for the L.A.W. respondents. The recreation or touring trip that accounted for over half of all the miles ridden by L.A.W. members represented only 22.7 percent of all miles ridden by WABA members. The trip length for this purpose is also considerably different. However the goodness of fit test (p = .05) showed that overall the average round trip distances for each purpose was not significantly different between the national and local samples. The "snapshot" of WABA activity showed that 81.4 percent of the respondents rode their bicycles the week before they filled out the survey. This compared to 67 percent of the L.A.W. respondents. However, WABA members received the questionnaire in late April or May, almost 6 weeks after L.A.W. members. This later date in better cycling weather probably accounts for the higher response. Almost 43 percent reported making 5 or more trips during the week, suggesting commuting trips to work or school. This is almost 28 percent more than L.A.W. respondents reported. As previously mentioned, WABA members appear to use their bicycles more for work and school trips than those in the national sample. ACCIDENT EXPERIENCEThere were 15 WABA respondents of the 70 who stated that they had experienced a serious fall or collision in.the last year. This percentage of the total (21.4 percent) is the same as reported for L.A.W. members. Three persons reported more than one incident for a total of 18 accidents experienced in 1974 for the 70 respondents. Calculations show that the rate of incidents is 167 per million miles. traveled, compared to a rate of 113 for the national sample. This rather large difference existing between the samples is hard to explain, although the small sample size in the case of the local organization may not be a true representation of the almost 1,000 members in WABA. Since the Washington Area Bicyclist Association members reside in a metropolitan area greater than one million in population, the accident rate calculated for this size city based on the national sampling was examined. It showed a rate of 115 accidents per million bicycle miles traveled, only slightly larger than the overall rate of 113 accidents per million bicycle miles traveled for the entire national sample. Only one injury occurred that required professional medical attention; the accident rate for those more serious accidents is 9.2 per million bicycle miles. However, since such a small sample is being investigated and only one incident in this category was reported, these accident rates should be only looked at as general indicators. Because of the small sample, it is not profitable to investigate accident occurrences and calculate rates beyond the analysis done so far. It right provide misleading findings and, therefore, any comparisons with the larger national sample results would most likely be meaningless. ATTITUDINAL QUESTIONSThe local respondents reported a temperature of 28.9 degrees as the minimum at which they would still usually ride a bicycle. This compares to 29.6 degrees for the overall national average and very close to the 29.9 degrees reported from national respondents living in Washington, D.C., Maryland, and Virginia. Eighty percent of the WABA members responding stated that they usually rode in the dark, higher than the 64.8 percent which was the national result on this question. This response may be due to the high intensity lighting in many parts of the District of Columbia. Also, 77 percent of the WABA members said that they used a light, which shows a pattern similar to the national results when light usage and riding at night are compared. Over 73 percent of the respondents stated that they also rode in the rain either "occasionally" or "frequently". The national sample showed a 75 percent response in these same categories. With regard to the question of obeying vehicle laws, only 30 percent stated that they "always" obey the laws that applied to them as bicyclists. There were 65 percent who stated they "usually" obeyed laws, with the remaining 5 percent reporting that they only "occasionally" obeyed laws. The 30 percent figure is even less than the 50.2 percent result from the national club sample. This may be because of a general lack of enforcement in the particular city under study (Washington, in this case), or it may be that safety and observance of iaws is stressed to a higher degree iii the League of American Wheelmen than in the Washington cycling organization. It is difficult to analyze further much of the local data due to the small sample size. Nonetheless, from the comparisons that were made, it appears that differences do exist between the two groups of bicyclists studied. How great these differences are, though, is difficult to quantify. In some instances, it appears that the 70 respondents are similar in riding characteristics to a subgroup of the national sample that is close in age, experience, or other variable. At other times, there seems to be no similarities between the groups. A larger response might have provided better insight into these differences and similarities. |
||||||||||||||||||||||||||||||||||||||||||||||||||||||||||||||||||||