| Top: John S. Allen's Home Page Up: Table of Contents Previous: Page separator Next: Chapter III separator |
 |
| Top: John S. Allen's Home Page Up: Table of Contents Previous: Page separator Next: Chapter III separator |
 |
CHAPTER II
|
PERMANENT COUNTERSA permanent counter is a machine counter installed to count continuously during the period of installation. The installation is usually planned to last several years; thus, wire loops are installed in the pavement to detect bicycles. Bicycle counts have been monitored in one permanent counter location in Eugene by the Oregon State Highway Division. This information was used for determining monthly variations in bicycle volumes. A number of permanent recorder stations for bicycle paths, similar to the permanent recorder stations used for cars, should be installed and operated by the City. The information will be useful for improved determinations of usage variation and accident rates. BIKEWAY USAGE VARIATIONAnnual, monthly, and daily bikeway facility usage variations have been investigated. ANNUAL VARIATIONBicycle volume counts are used to determine changes in the number of bicycle users from year to year. Prior to this project, various bicycle counting projects had been conducted, particularly near the University area. Typically, these counts have been conducted for random short intervals with no efforts made to expand the data to a 24-hour count. The usefulness of such counts is limited. In 1971, several 5-hour bicycle counts were taken at intersections near the University during the first week in August awhile summer school was in session). The results of these counts were expressed as the number of bicycles entering the intersection per hour. In the first week of August 1978, the 1971 counts were repeated with 8-hour counts that included the time period during which the 1971 5-hour counts were taken. A 76% average increase was measured for the intersections over the seven-year period. The results of the two sets of bicycle counts are given below:
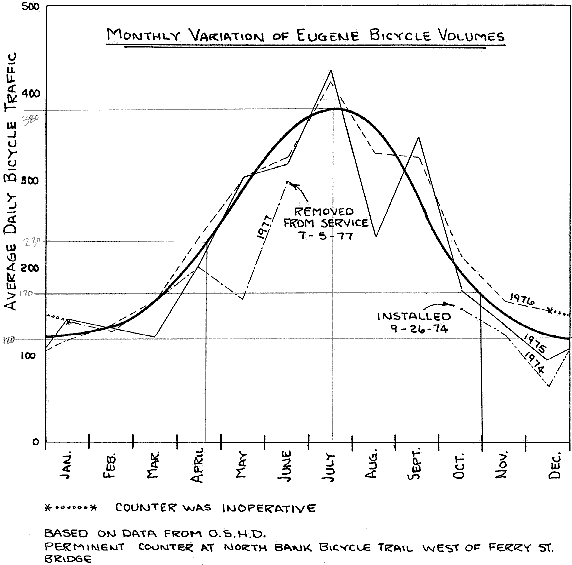
The 1978 data collected throughout Eugene will be useful for improving the measurement of annual changes of bicycle ridership. It is recommended that the City conduct annual bicycle volume counts in specific locations throughout the City, to establish accurate annual variation statistics. This information will be a useful supplement to "permanent recorder station" information when the City installs such equipment. MONTHLY VARIATIONThe monthly variation of bicycle usage provides a measure of the effects of seasonal variations on bicycle ridership. Because of the considerable daily variation in bicycle usage, which is discussed in the following section, it is not appropriate to measure monthly variations using a one-day sample for each month. "Permanent recorder" measurements of bicycle volumes provide volume information for each day of the month, as well as each month of the year. Average daily bicycle traffic can be established for each month. The Oregon State Highway Division installed and monitored a permanent recorder on the North Bank Bicycle Trail, west of the Ferry Street Bridge. The recorder was installed on September 26, 1974, and removed from service on July 5, 1977. The average daily bicycle traffic for each month during which the counter was operative are plotted below. |
||||||||||||||||||||||||||||||||||||||||
[Note: the lighter numbers in the left column
and the lines extending from them were drawn in
pencil in in the copy furnished to me -- Web editor]

| The heavy dark line describes the seasonal variations of the
bicycle volumes. Bicycle ridership nearly tripled from the winter months to the summer
months. Bicycle ridership is lowest in December and January, and increases gradually
through March and April, until it peaks out in July or August. The bicycle ridership
steadily increases to a peak in the longer days of the summer months, and then gradually
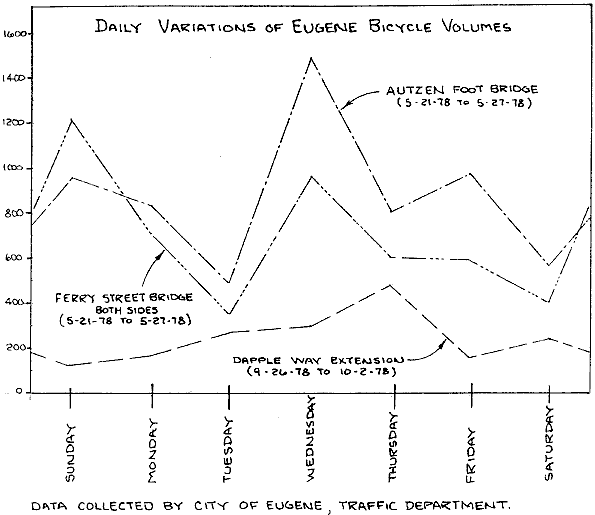
decreases steadily until December. There was a significant number of bicycle riders at all times during the year. There is a permanent counter station located along the river trail, which is parallel to both the Willamette River and Interstate 105, and connects the Valley River Center and the Ferry Street Bridge. The Greenway Bike Bridge was not installed during the period in which the volume data were collected; thus, it can be reasonably projected that the majority of the trips on this route were recreational and shopping trips. Commuting or school trips are not likely to have made up a large portion of the trips. There is evidence that the seasonal variations for school or work commuting will be different from recreation and shopping trips. The Citizen Survey conducted as part of this project determined that 91% of the commuting bicycle drivers use their bicycles in the rain. A Campus Bicycle Survey[1], independently conducted in 1976, determined that 78% of the bicycle drivers rode to campus in bad weather. It is apparent that the effects of seasonal variations for different trip purposes will be different. The results described in Figure II-1 are representative for shopping and recreational trips. Further data should be collected along other bicycle paths to establish the effects of seasonal variations on bicycle ridership in other parts of Eugene. DAILY VARIATIONSSeven-day motor vehicle traffic measurements are used to establish the pattern of traffic movement variation on different days of the week. To determine the variation of bicycle usage on different days of the week, several weekly machine counts were taken and analyzed along bikeways in Eugene. Figure II-2 on the following page, records the data from bicycle counts from three route locations. |

Unlike motor vehicles, the daily variation of bicycle usage does not occur regularly
on specific days of the week. High and low bicycle counts were observed to occur
throughout the week. The Tuesday and Thursday dip in volumes noted above, would suggest
that classes were on a Monday, Wednesday and Friday schedule. Significant numbers were
noted on each day of the week; however, a usage pattern was not apparent.BICYCLE ACCIDENT RATESThe number of accidents on a particular route is not an adequate measure of the relative safety of that facility, because the usage of each facility varies considerably. For the 1978 data collected, usage of different facilities varied between 2 bicycles per day and 2,665 bicycles per day. For this project, the accident rate of occurrence is defined as the number of accidents per 100,000 bicycle miles per year. This measure has been used to compare the relative safety of all bicycle facilities in the project area. To determine bicycle miles driven on a facility, both the length of the facility and the average number of users on the facility must be known. Accident rates determined for this study are based on single measurements taken in August and September 1978. Future measurements for specific locations and permanent counter station measurements will help to refine the accident rate determinations. The methods used for accident rate determinations and the results for Eugene facilities, are described in the next chapter of this report. RECONNAISSANCE SURVEYA reconnaissance survey of all Eugene bicycle facilities was conducted during the initial phase of the project. All bicycle facilities were ridden to observe how the bicycle facilities and traffic control devices affect the safe and efficient movement of bicycle, motor vehicle, and pedestrian traffic. In addition to the Reconnaissance Survey, each of the routes or paths were ridden to locate hazards and evaluate ridability. Specific bicycle facility improvements and recommendations for general improvements of the bikeway system are covered in Chapter VI. With the exception of the sidewalk routes along arterial streets, the routes were generally found to be well designed, in good condition, and pleasant to ride. SUMMARYData from manual counts, machine counts, and permanent counter counts show that bicycle traffic increased an average of 75 percent from 1971 to 1978, that bicycle traffic is highest during the summer months and lowest during the winter months, and that there is no definite pattern in daily variations of traffic as there is for motor vehicles. |
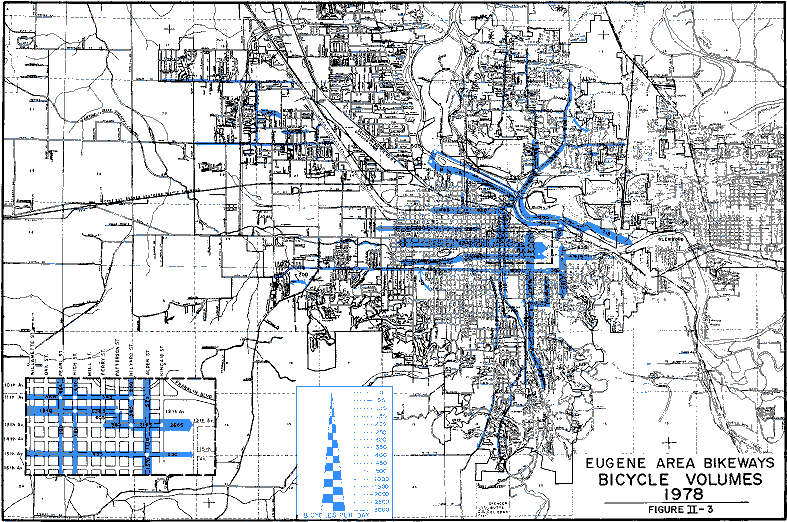
FIGURE II-3, BICYCLE VOLUME MAP
Larger scan (bicycle counts legible)

| The 1978 count data, expanded to uniform 24-hour counts, are shown on the Bicycle
Volume Map. [1] Campus Bicycle Survey conducted by Bruce Walker, SEARCH Instructor, University of Oregon |
| Top: John S. Allen's Home Page Up: Table of Contents Previous: Page separator Next: Chapter III separator |
Government document, public domain Last modified September 24, 2002 |